Search by Keyword
Understanding the Team Tab
Overview of Team Tab
Summary Views
Summary Views: Summary Views provide a customizable dashboard for comparing opponent’s offensive and defensive stats across various splits. You will also see the Stat (NCAA Rank) followed by the NCAA Average. Below the Summary Views chart you will see a player report using the Team Summary Stat Profile and the splits you’ve selected for the view.
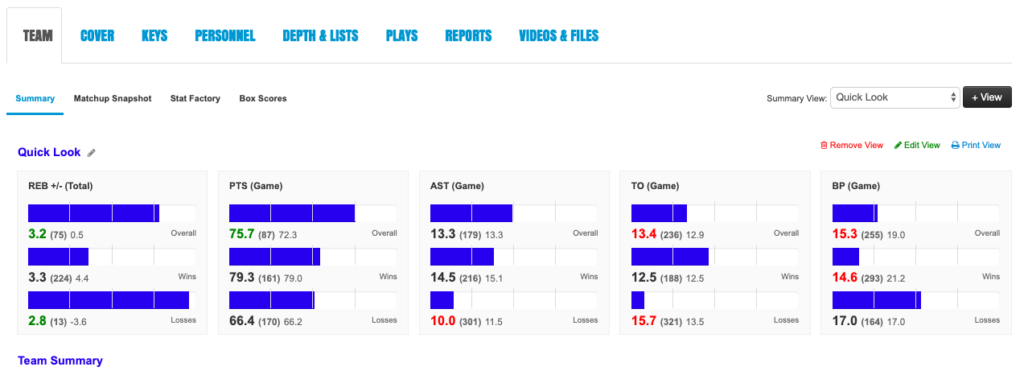
The text color is representative of the comparison to the national percentile (Green = Top 3rd, Black = Middle 3rd, and Red = Bottom 3rd in the country in that field). The actual statistic is shown on the right with the corresponding rank, opponent value and rank and national avg.
Matchup Snapshot
Four Factor Breakdown “Snapshot”: This is a breakdown of the Dean Oliver’s 4 Factor Stats.
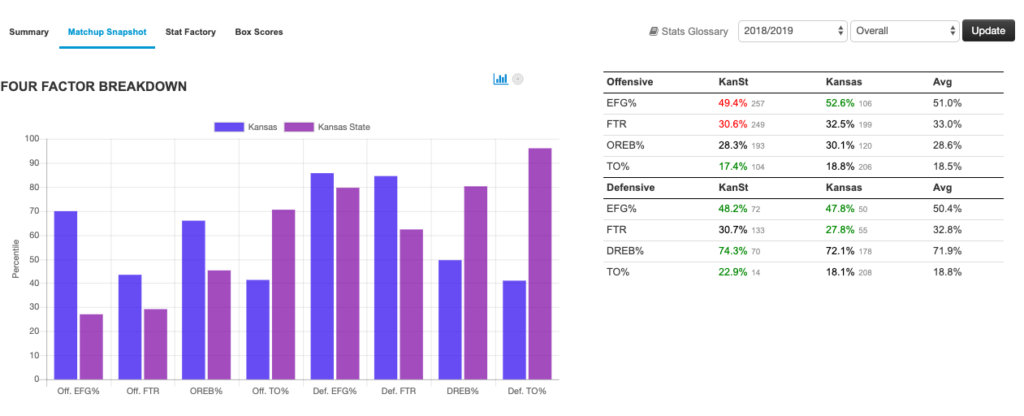
- Off. EFG% – Effective Field Goal Percentage
- This statistic adjusts for the fact that a 3-pt field goal is worth one more point than a regular 2-pt field goal. For example, if Player A is 4/10 with two 3-pointers and Player B is 5/10 with zero 3-pointers, both players would have the same number of points (10). Thus, both players’ EFG% equals 50%.
- Off. FTR – Offensive Free Throw Rate
- Free Throw Rate is about earning more trips to the foul line. It measures both how often a team gets to the line and their free throw shooting performance. Offensively, a high FT RATE is desired.
- OREB – Offensive Rebound Rate
- Rebound Percentage gauges how effective a team is at gaining possession after a missed field goal or free throw. Offensively, a high REB% is desired.
- Off TO% – Offensive Turnover Percentage
- The percentage of offensive possessions that result in a turnover. Offensively, a low TO% is desired.
Note: The Defensive values for this chart would be the Team’s Opponents Statistics. Therefore, how quality is this team defensively. This is only available within the Scouting Reports section.
Comparisons
Traditional Comparison: This report is a comparison of you vs your opponent from a traditional stats perspective (Scoring, Shooting, Non-Shooting stats)
Only available within a scouting report. This report can be automatically added to the scouting report via Scout Templates > Report
Advanced Comparison: This report is a comparison of you vs your opponent from an advanced stats perspective (Example: Pace, Efficiency, 4 Factor and more)
Only available within a scouting report. This report can be automatically added to the scouting report via Scout Templates > Report
Stat Factory / Other Reports Available in the Reports Tab
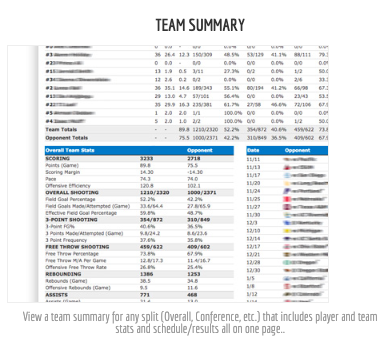
Team Summary: A breakdown of a team’s player stats, team stats, and schedule over the course of the split you have selected, or over the course of the combined box scores you have selected for a custom report. This is a blend of team stats + team leaders.
Available in Stat Factory or available within a scouting report. This report can be automatically added to the scouting report via Scout Templates > Report. Custom reports will be available via combined box scores.
Team Stats: A breakdown of the selected team’s offensive and defensive stats. This is more of an overview of that team in general for the split you have selected.
Available in Stat Factory or available for automation within a scouting report. This report can be automatically added to the scouting report via Scout Templates > Report
Available in Stat Factory or available within a scouting report. This report can be automatically added to the scouting report via Scout Templates > Report
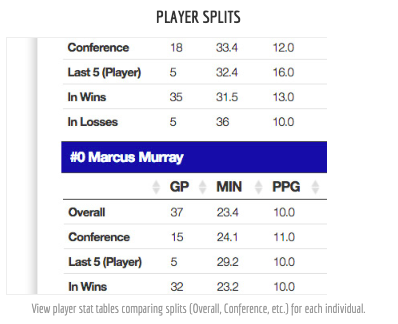
Player Splits: A breakdown of each player and each split to compare across different splits. This will display each of player’s stats in a variety of splits (Overall, Conference, Last 5 (Team), Last 5 (Player), Wins, Losses, Home, Away, Neutral, vs. Top 25 and every month of play.
Only available within the Stat Factory. This report is widely used as a quick reference to see how specific players play in a variety of the splits mentioned above, example: Overall vs. Wins. vs. Losses
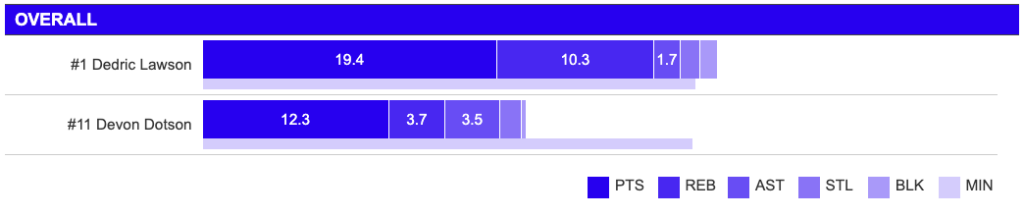
Player Productivity: This report will provide a data visualization of player productivity in comparison to the minutes they play. The higher the player productivity the shorter the distance will be from the top bar (Points, Assist, Rebounds, Steals, Blocks) and the minutes bar underneath.
Only available within the Stat Factory. This report is widely used as a quick reference to see which players take the most advantage of their minutes on the court.
Team Trends: This report will give you insight into a programs team stats over the course a various splits that you have available per your package. This could include: Overall, Conference, Last 5, Wins vs. Losses, Home vs. Away, November, December, January, February, March, vs. Top 25. You have the ability to generate this report for both offensive and defensive trends, or just one specific.
This report is only available within the Reports Section of your scouting report. You can create templates the report, but please select a stat profile to use when building this report to select the proper stats that you wish to use.