Search by Keyword
Team and Player Analytics
Just Play’s Team and Player Analytics can provide powerful insights into how your athletes are using your system. By providing time and page-view information, coaches have the option to look at how players are preparing for practice and games.
Player Analytics
- From the Analytics section in the left-side navigation of your team admin, select Individual Reports.
- You will see a list of your players with general usage information. You can change the date range for the reporting by clicking on the date in the top right corner of the table. You can also sort players from least activity to most activity in both total time and total page views by clicking on those respective headers in the player table.
View an individual player’s detailed activity:
- Click on the player’s name in the player list.
- A line graph will display time and page-view information for the individual player selected.
- To view detailed information for a given day, click on the data point along with the line graph. This will open up a page showing this player’s activity including every page he or she visited along with a timestamp and total time on each page.
Team Analytics
-
From the Analytics section in the left-side navigation of your team admin, select Team Dashboard.
-
You will see two graphs displaying team usage information. You can change the date range for the reporting by clicking on the date in the top right corner of the page.
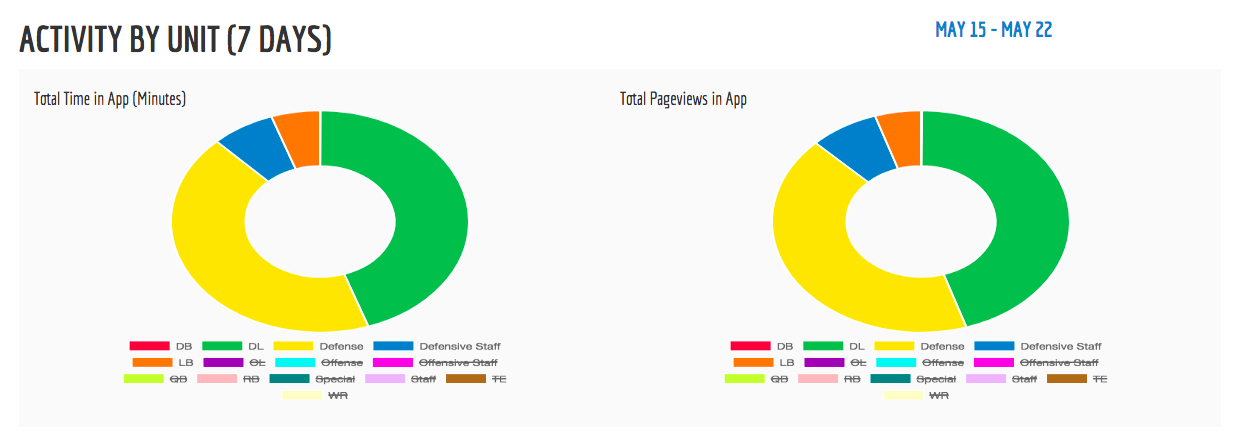
The two pie charts shown in the top section display total time and total page views by Group. You can filter the groups that are displayed in the graph by clicking on the group name below each graph.
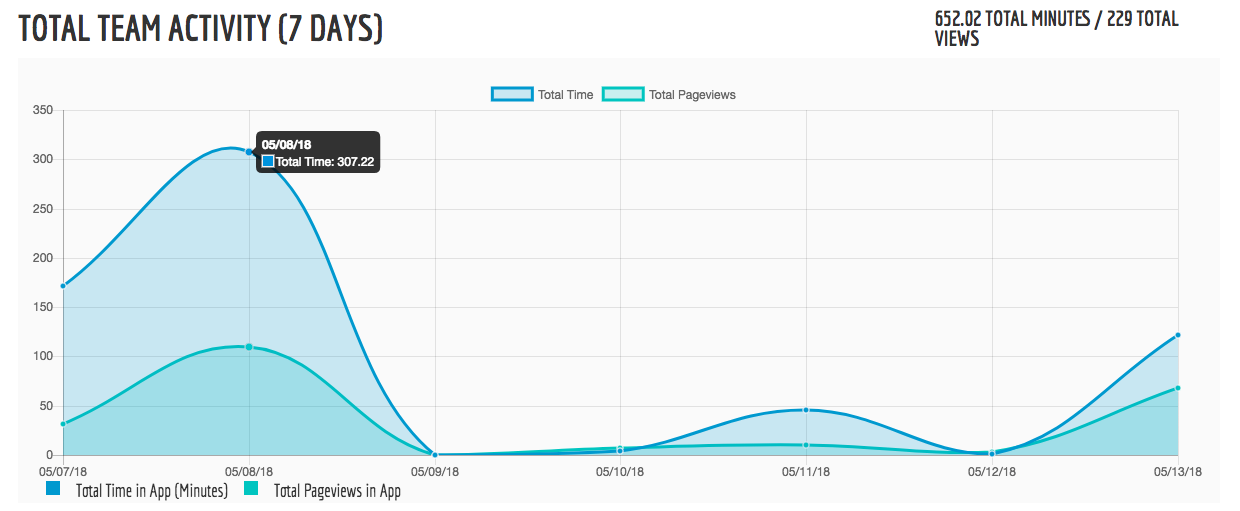
The line graph shows total team activity in minutes and page views. You can view the raw numbers for each day by hovering on the data points along the line.