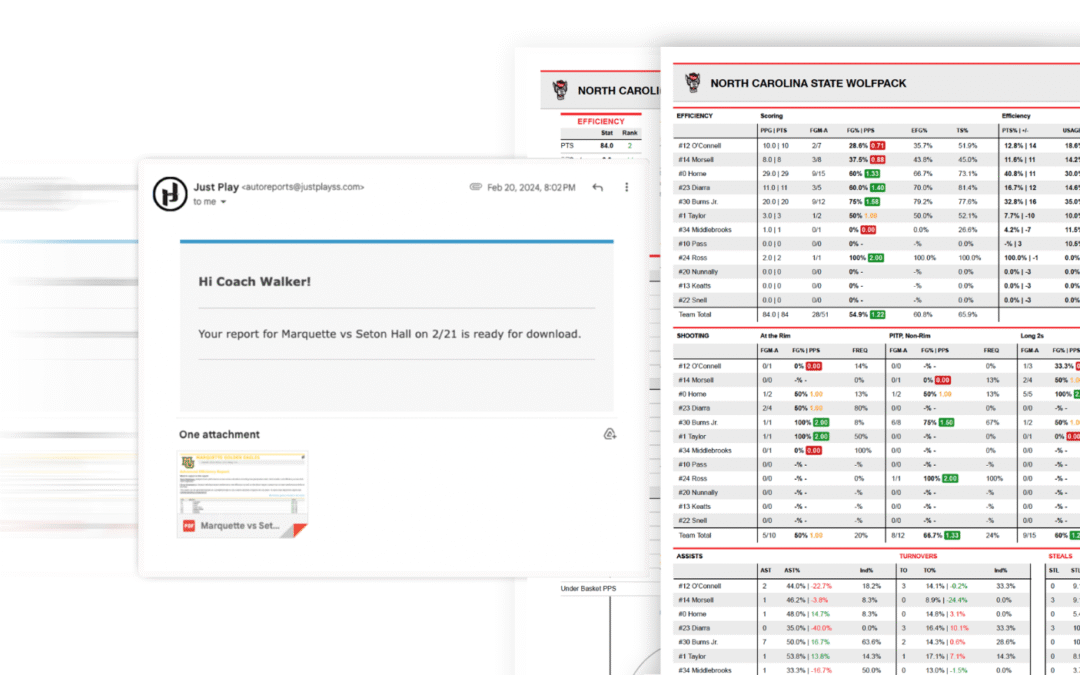
Every coach gets a box score after a game. It’s the first thing handed out in the locker room. But if you’ve ever looked at one and thought, this doesn’t tell me what actually happened, you’re not alone.
That’s why we built the Postgame Report — a four-page, auto-delivered breakdown that gives you the full picture of what happened the second the game ends. It’s not another stat sheet. It’s a teaching tool, a scouting tool, and a decision-making tool all in one.
Here’s what’s inside.
Page 1: Game Context
- Schedule view — places the game within the season (last five games, home/away, wins vs. losses).
- Efficiency overview — key team efficiency numbers that highlight whether you played at your pace or theirs.
- Starting point for the story — coaches use this page to spot trends: are we better at home? Are we different in wins vs. losses? How does this game fit the bigger picture?
This page sets the table. Before you dive into the weeds, you see the season context that matters.
Page 2: Player Box Score — With Efficiency
The box score you normally get tells you points and rebounds. This one tells you impact.
- Efficiency ratings — who truly contributed to winning possessions, not just who filled the stat sheet.
- Shot type breakdowns — what kind of looks each player got (catch-and-shoot, drives, paint touches, etc.).
- Points per shot attempt — a clearer measure of who created value when they touched the ball.
- Player Impact — On vs off court analysis
Coaches often find this page changes their perception. A player who scored 12 points may have been a net negative, while a role player who only scored four may have swung the game with efficiency.
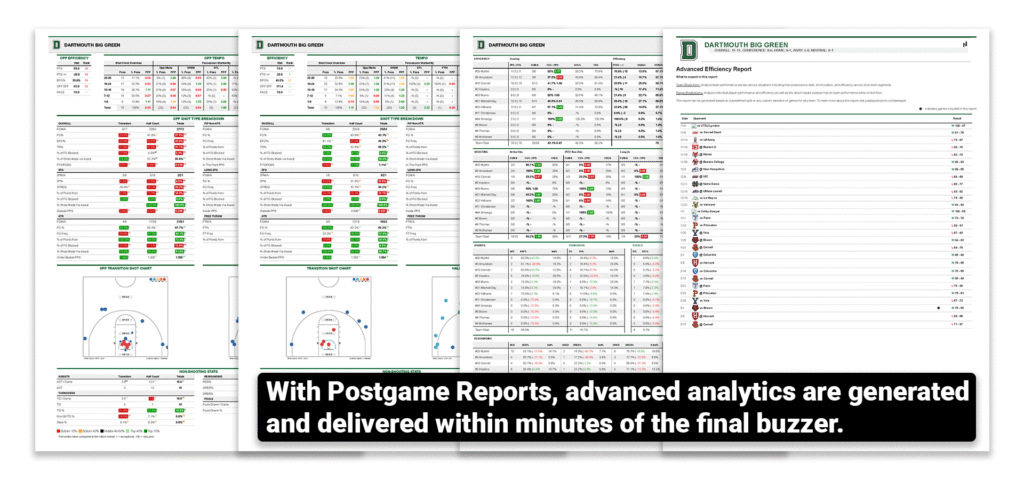
Page 3: Tempo and Team Offense
This is where the Postgame Report goes beyond anything a box score can give.
- Possessions by shot clock segment — early offense, middle of the clock, late-clock breakdowns.
- Points per possession by tempo — shows exactly when your team was most efficient.
- Pace analysis — how fast you played, how fast your opponent played, and where that balance impacted results.
- How possessions start — Analyze possession starts
Coaches use this page to make real adjustments:
- Sub patterns when fatigue impacts pace and rebounding.
- Teaching points for players (“we scored 1.2 PPP in the first 8 seconds of the clock, let’s push harder in transition”).
- Opponent tendencies that feed directly into the next scout.
Page 4: Defensive & Opponent Analysis
Every offensive page has a defensive mirror.
- Opponent efficiency — same tempo and shot clock breakdowns, but from their perspective.
- Shot chart visuals — where they scored most often and how they got their looks.
- Tempo pressures — which combinations hurt you the most.
This page flips the lens: not just what you did, but what your opponent did against you.
Why Coaches Value It
From pro assistants to college head coaches, the feedback is consistent:
- Speed — the report is in your inbox minutes after the game ends. Often before you leave the floor.
- Clarity — four pages, organized, visual. Not overwhelming, but deep enough to act on.
- Impact — coaches consistently say it swings 3–4 games a year. That’s the difference between finishing .500 and making the tournament.
- Player buy-in — players trust what they can see. Visuals like shot charts and tempo graphs give them confidence in what the staff is saying.
As one coach put it:
“Your eyes lie to you. There’s no way to keep up with every lineup, every possession. This report does it for you.”
Why It’s Different
Other platforms can give you a shot chart or a stat dump. But no one delivers a ready-to-use, four-page report & the opportunity to go beyond the box score within minutes of the final buzzer sounding:
- Automatically generated and delivered.
- Visually designed for coaches, not data scientists.
- Comprehensive — offense, defense, tempo, players, context.
- Customizable — easily filters for wins/losses, last five games, or specific opponents.
It’s a low-lift, high-impact tool that saves hours of postgame work and turns raw data into usable coaching information.
The Post Game Report isn’t just another stat sheet, it’s the edge every coach needs. Four pages. Delivered automatically. Packed with insights you can use before you even leave the gym. Don’t settle for a box score when the information to win more games is right here.
Talk to our team today and see how the Post Game Report can work for your program.